We believe Spiff is the world’s most powerful commission automation platform, and as such, every company with any type of incentive compensation plan could use us. However, despite our best efforts, some companies will want to manage sales commission calculation in Excel. This is often the case for:
- Companies without a CRM
- Companies with simple and infrequent commissions
- Companies that don’t want to provide their reps with (real-time) visibility into their commissions
- Companies that don’t want to pay for commission software
- Companies that feel more comfortable in Excel (for whatever reason)
- Companies that would rather spend significant time and resources calculating commissions, manually managing disputes, and learning new formulas in Excel instead of doing something awesome like surfing
Some companies feel like they need to use spreadsheets because their plans are “too complicated.” This has become a bit of an inside joke at Spiff because every company feels their commission plans are too complex for Spiff. If this is your reason, drop me a line. So far, we haven’t found a plan we can’t automate in Spiff.
In situations like those described above, Excel or Google Sheets can definitely get the job done. So we wanted to provide some industry best-practices on how to build commission spreadsheets.
This is the first article in a series on Spreadsheets at Spiff, aimed at helping those of you manually managing your commissions in spreadsheets. Our hope is that it’ll help make your life just a little bit easier–as we know as well as anyone how absolutely painful managing commission plans really is.
Today we’re going to be talking about sales accelerator commission plans using marginal payout.
In this article, we’ll cover
- What is an accelerator commission plan?
- What does marginal payout mean?
- How to make a dynamic marginal payout plan by rep
- How to use quota attainment to calculate accelerator rates
- Provide an example Excel spreadsheet demonstrating these topics
For those of you wanting to jump to the finished product, feel free to check it out here. For the rest, let’s answer the first two questions first–they’re critical to the remaining topics.
What is an accelerator commission plan?
An accelerator commission plan is one where as a sales rep meets certain quota benchmarks, the rate at which they earn commissions increases. Sometimes companies refer to these commissions as “overachievement” commissions. Statistical research has shown that “overachievement” commissions improve rep performance.
For instance, suppose you have a plan that looks like this:
| Min | Max | Rate |
| $0.00 | $5,000.00 | 10% |
| $5,000.00 | $7,500.00 | 11% |
| $7,500.00 | $10,000.00 | 12% |
| $10,000.00 | $12,000.00 | 15% |
| $12,000.00 | $13,000.00 | 20% |
| $13,000.00 | 25% |
In this example, if you sell up to $5k, then it pays out at 10%, if you sell up to $7.5k, it pays out at 11%, if you sell up to $10k, it pays out at 12% and so on.
What does marginal payout mean?
A common response I’ve found to this question is, marginal payout works very similarly to the way taxes work. Is that helpful?
If you’re like me, then you’re probably thinking “Ok, great. How do taxes work?” Great question. Let’s discuss this further.
When I was a kid, my grandparents had this really cool fountain in their backyard–it was a series of cascading buckets. When you turned the fountain on, the water would flow from the top into the first bucket. Then the fountain would “stop” for a minute while the first bucket filled up, and then it would overflow into the second bucket, “stop”, and so on until all the buckets were filled and the water finally ended up in the pond below.
Marginal payout works very similarly. However, instead of an infinite source of water at the top, you have a source bucket with a finite amount of “water” in it. You start pouring it into the fountain, and eventually, your source bucket is empty, and there is some distribution of water in buckets at various stages of the fountain.
Consider the example below:
| Min | Max | Rate | Allocation | $13,500.00 |
| $0.00 | $5,000.00 | 10% | $5,000.00 | $8,500.00 |
| $5,000.00 | $7,500.00 | 11% | $2,500.00 | $6,000.00 |
| $7,500.00 | $10,000.00 | 12% | $2,500.00 | $3,500.00 |
| $10,000.00 | $12,000.00 | 15% | $2,000.00 | $1,500.00 |
| $12,000.00 | $13,000.00 | 20% | $1,000.00 | $500.00 |
| $13,000.00 | 25% | $500.00 | $0.00 |
Suppose you have $13.5k in your “source” to pour out. You can see in this example in the “Allocation” column how much lands in each “bucket”. When a bucket reaches its fill, then the marginal payout jumps to the next bucket until all the cash has been distributed.
Now that you know how much cash is in each bucket, the next thing you want to do is calculate the amount of commission that you earn in that bucket. So you take the “Allocation” amount and multiply it by the “Rate” column to get the commission earned for a bucket and sum up those to get the total commission.
| Min | Max | Rate | Allocation | $13,500.00 | Commission |
| $0.00 | $5,000.00 | 10% | $5,000.00 | $8,500.00 | $500.00 |
| $5,000.00 | $7,500.00 | 11% | $2,500.00 | $6,000.00 | $275.00 |
| $7,500.00 | $10,000.00 | 12% | $2,500.00 | $3,500.00 | $300.00 |
| $10,000.00 | $12,000.00 | 15% | $2,000.00 | $1,500.00 | $300.00 |
| $12,000.00 | $13,000.00 | 20% | $1,000.00 | $500.00 | $200.00 |
| $13,000.00 | 25% | $500.00 | $0.00 | $125.00 | |
| Total Commission | $1,700.00 |
Spiff has created a fun marginal payout visualizer you can play around with to help solidify this concept.
Applying Marginal Payout in an Accelerator Commission Plan
There are a handful of ways we’ve seen this concept applied. It can apply at the single deal level, or over an entire statement period (i.e. quarter, month, week, etc). In the example we’re going to demonstrate, we’re going to apply it to all the sales in an entire month.
Another factor we’ve found is–how do you apply marginal payout in an accelerator commission plan when each of your reps have a different quota? The table we’ve provided above works great when each of your reps have the same min/max values for their tiers, but what happens when you want the same rate for your reps, but they have individual quotas? We’re glad you asked! That’s exactly why we have written this guide because this is not an easy problem to solve.
The first thing we need to do is conceptually understand this next step, because it gets a little hairy. With the example provided above, the total commission off the original $13.5k is $1.7k. The effective commission rate for that scenario is $1.7k / $13.5k = 12.59%, as shown below.
| Min | Max | Rate | Allocation | $13,500.00 | Commission |
| $0.00 | $5,000.00 | 10% | $5,000.00 | $8,500.00 | $500.00 |
| $5,000.00 | $7,500.00 | 11% | $2,500.00 | $6,000.00 | $275.00 |
| $7,500.00 | $10,000.00 | 12% | $2,500.00 | $3,500.00 | $300.00 |
| $10,000.00 | $12,000.00 | 15% | $2,000.00 | $1,500.00 | $300.00 |
| $12,000.00 | $13,000.00 | 20% | $1,000.00 | $500.00 | $200.00 |
| $13,000.00 | 25% | $500.00 | $0.00 | $125.00 | |
| Total Commission | $1,700.00 | ||||
| Effective rate | 12.59% |
Assuming you’re following me thus far, then there’s a small adjustment we need to do to make this work with situations where reps have different quotas.
We need to introduce the concept of quota attainment. Suppose for this example a rep sells $18.2k in a month and has a quota of $10k in that month. Quota attainment is calculated as
[ Total Sales ] / [ Monthly Quota ], or $18.2k / $10k = 182%
When using marginal payout with quota attainment, what you do is instead of using dollar values for the min/max values, you use percentages.
| Quota Attainment | Min | Max | Rate |
| 0% to 75% | 0% | 75% | 7% |
| 75% to 85% | 75% | 85% | 10% |
| 85% to 95% | 85% | 95% | 12% |
| 95% to 100% | 95% | 100% | 15% |
| 100% to 110% | 100% | 110% | 20% |
| 110% to 125% | 110% | 125% | 25% |
| 125%+ | 125% | 30% |
So in this example, if your quota attainment is between 0-75%, then you get a 7% commission rate, for 75-85% you get 10%, for 85-95% you get 12%, etc.
Let’s use the 182% quota attainment value calculated from above. Similar to the bucket water fountain example with cash, this works exactly the same way, except we’re using percentages and not cash. So for the first bucket has a range of 75%, and will take 75% of the quota attainment, 10% goes into the second bucket, 10% goes into the third bucket, etc., until all 182% of the attainment has been allocated.
| Quota Attainment | Min | Max | Rate | Allocation | 182% |
| 0% to 75% | 0% | 75% | 7% | 75% | 107% |
| 75% to 85% | 75% | 85% | 10% | 10% | 97% |
| 85% to 95% | 85% | 95% | 12% | 10% | 87% |
| 95% to 100% | 95% | 100% | 15% | 5% | 82% |
| 100% to 110% | 100% | 110% | 20% | 10% | 72% |
| 110% to 125% | 110% | 125% | 25% | 15% | 57% |
| 125%+ | 125% | 30% | 57% | 0% |
Then, exactly like how we did with the cash example from above, we take the allocation amount and multiply it by the rate amount to give the percentage of the commission that falls into each bucket, and we sum them up to get the total commission percentage for the entire accelerator–31%.
| Quota Attainment | Min | Max | Rate | Allocation | 182% | Commission |
| 0% to 75% | 0% | 75% | 7% | 75% | 107% | 5.25% |
| 75% to 85% | 75% | 85% | 10% | 10% | 97% | 1.00% |
| 85% to 95% | 85% | 95% | 12% | 10% | 87% | 1.20% |
| 95% to 100% | 95% | 100% | 15% | 5% | 82% | 0.75% |
| 100% to 110% | 100% | 110% | 20% | 10% | 72% | 2.00% |
| 110% to 125% | 110% | 125% | 25% | 15% | 57% | 3.75% |
| 125%+ | 125% | 30% | 57% | 0% | 17.12% | |
| Total Commission % | 31% | |||||
| Effective Rate | 17% |
This last step is the kicker. In the cash example from above, we take the total commission, $1.7k, and divide it by the total amount to be allocated, $13.5k, to get the effective commission rate for the accelerator ($1.7k / $13.5k = 12.59%). We need to do the exact same thing here and divide the total commission percentage, 31%, by the amount to be allocated, 182%, to get the effective commission rate for the accelerator (31% / 182% = 17%).
Example Accelerator Commission Calculator Using Marginal Payout in Excel
Here’s a preview of the sample commission statement we’re creating:

A few key things to point out is that we have the capability to select which statement period we’re calculating for (date range) and we can select which rep to display. It uses these two inputs to generate the commission statement and displays some of the key stats/calculations to use, like total sales, quota attainment, and effective commission rate.
To create this, we need 3 key tables:
- Sales Reps
- Quotas
- Deals
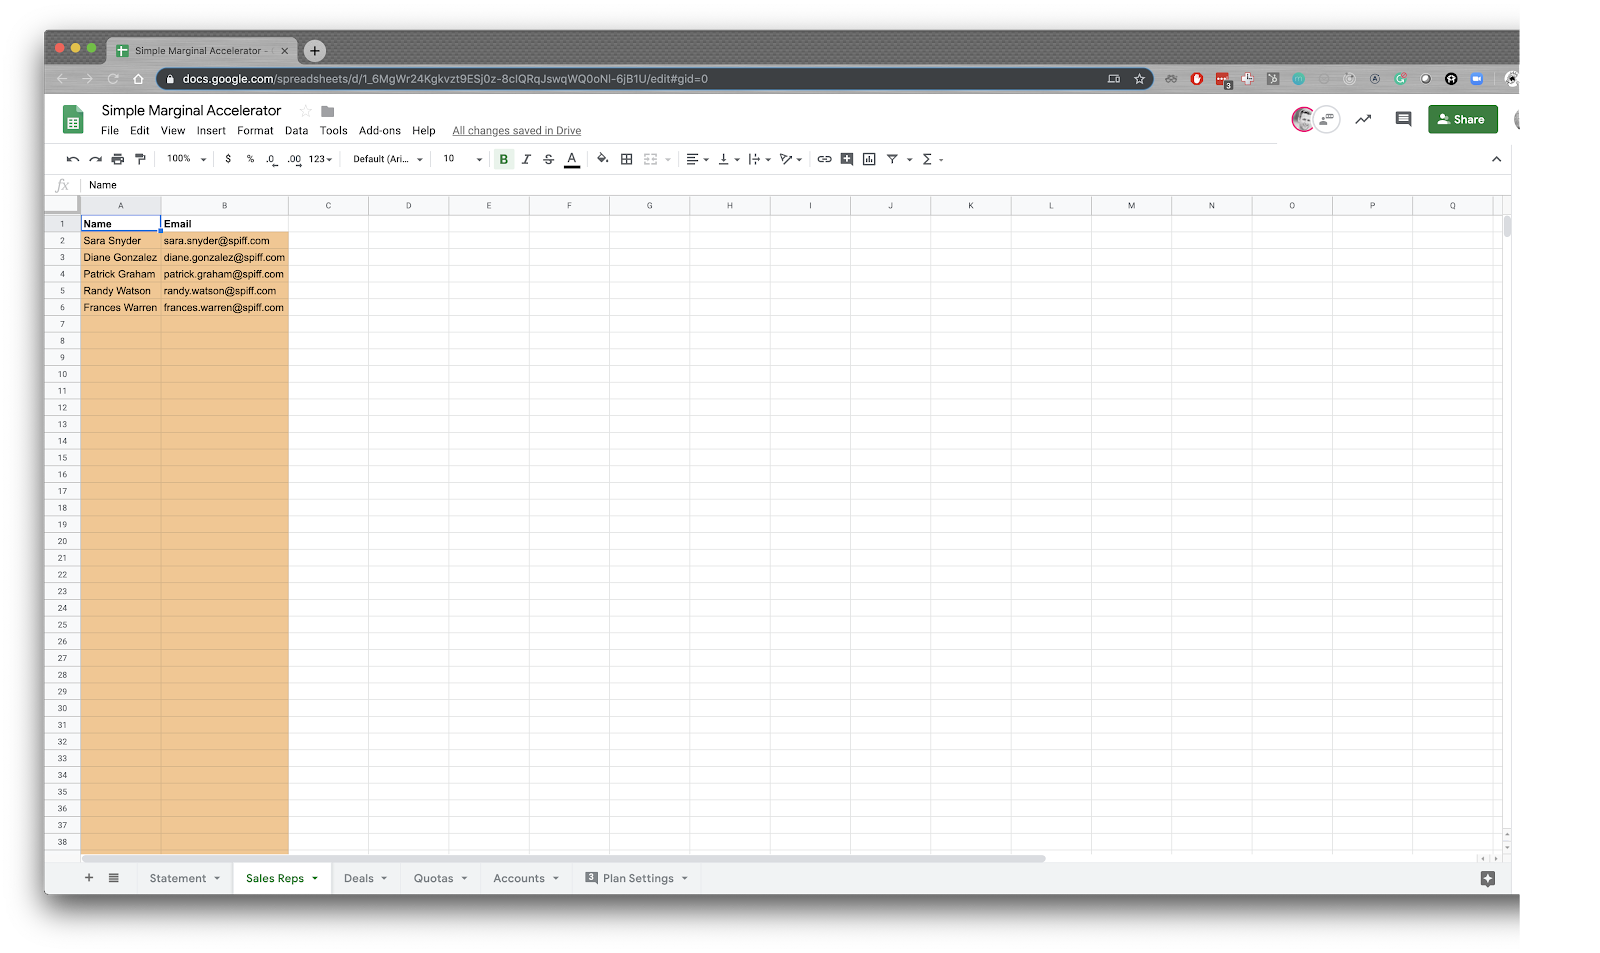
Sales Reps
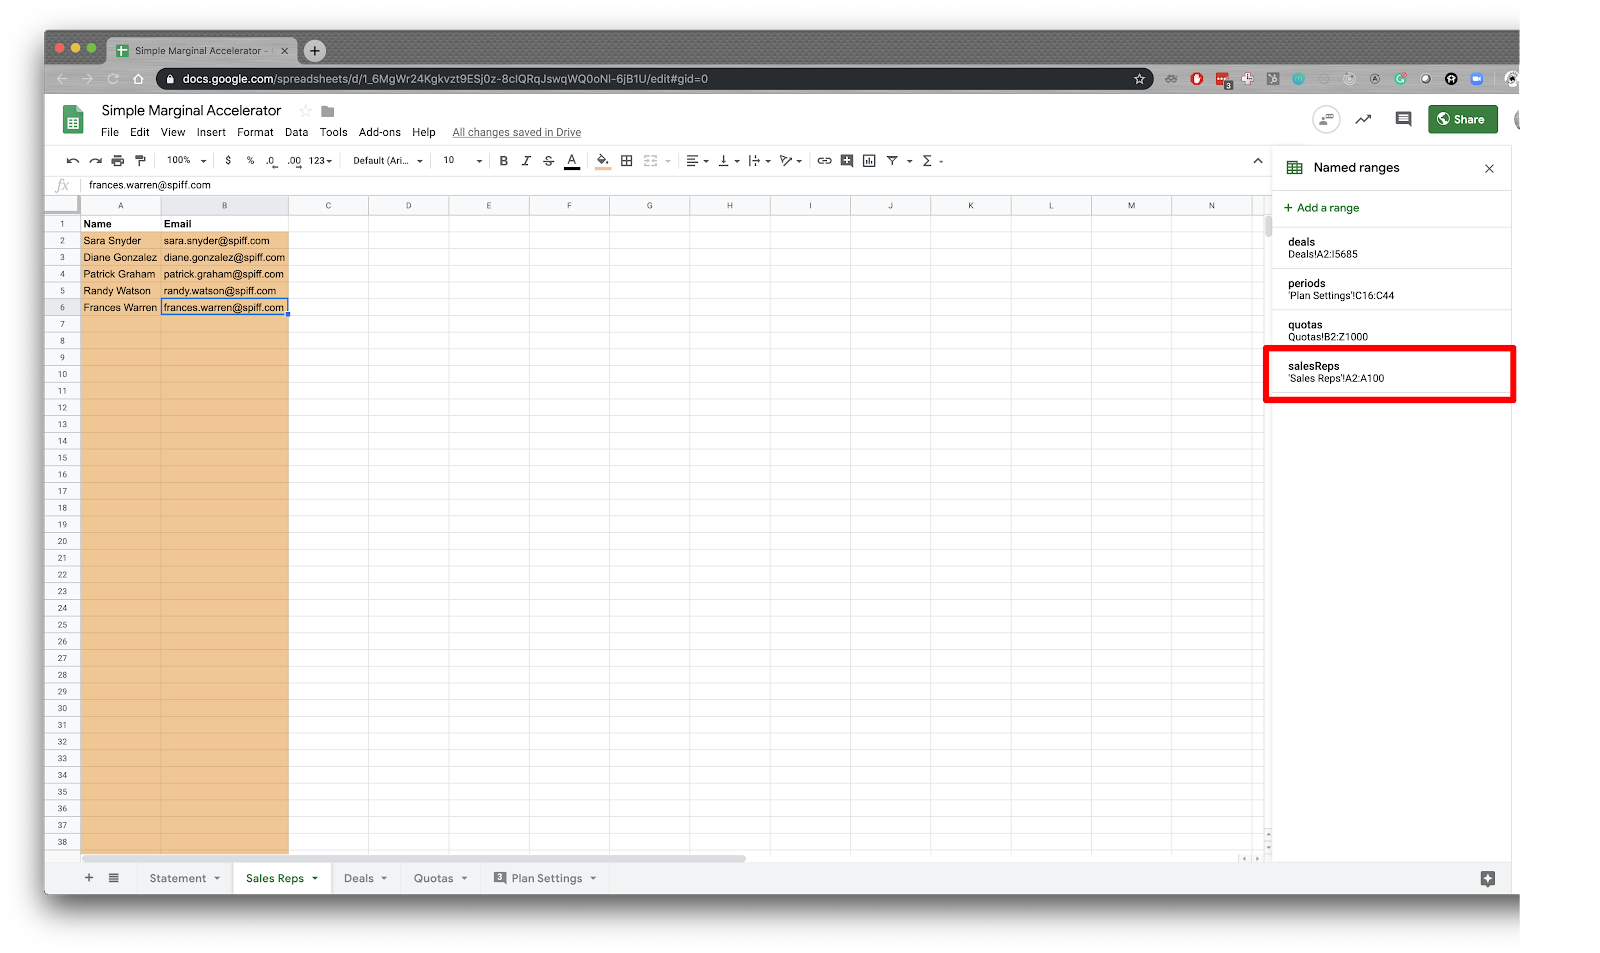
The Sales Reps table is literally just a list of potential reps to choose from in the drop down list. Nothing too fancy here.
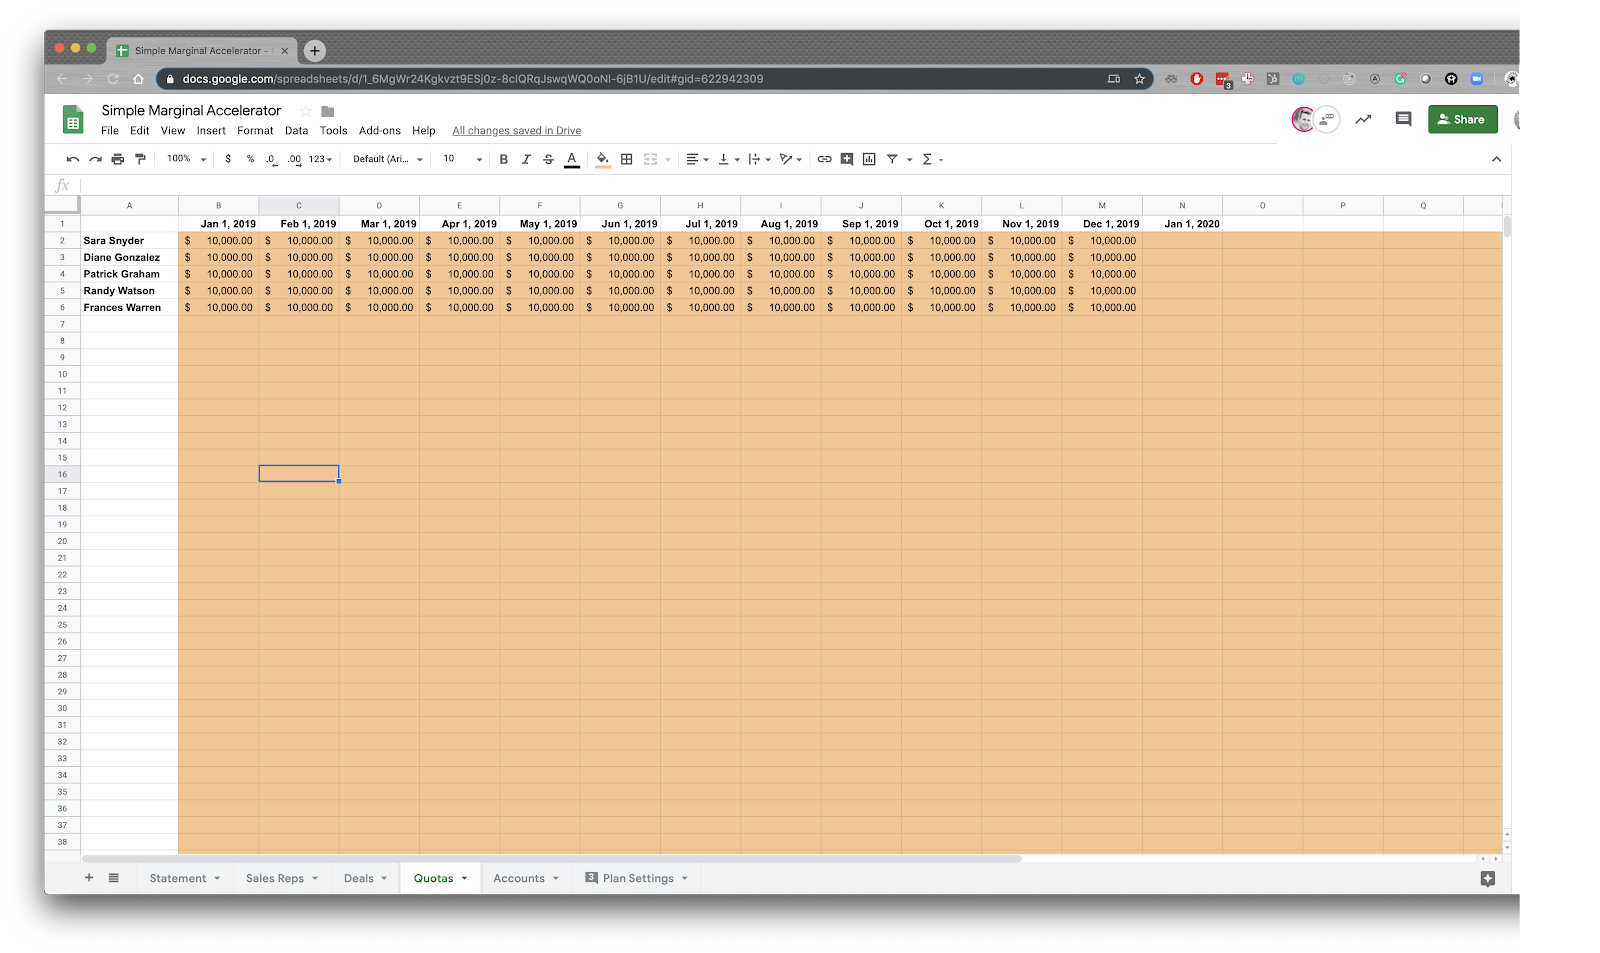
Quotas
The quotas tab allows us to define the monthly quota by rep in terms of total revenue generated during the month. This is the value that will be used as the denominator in calculating quota attainment.
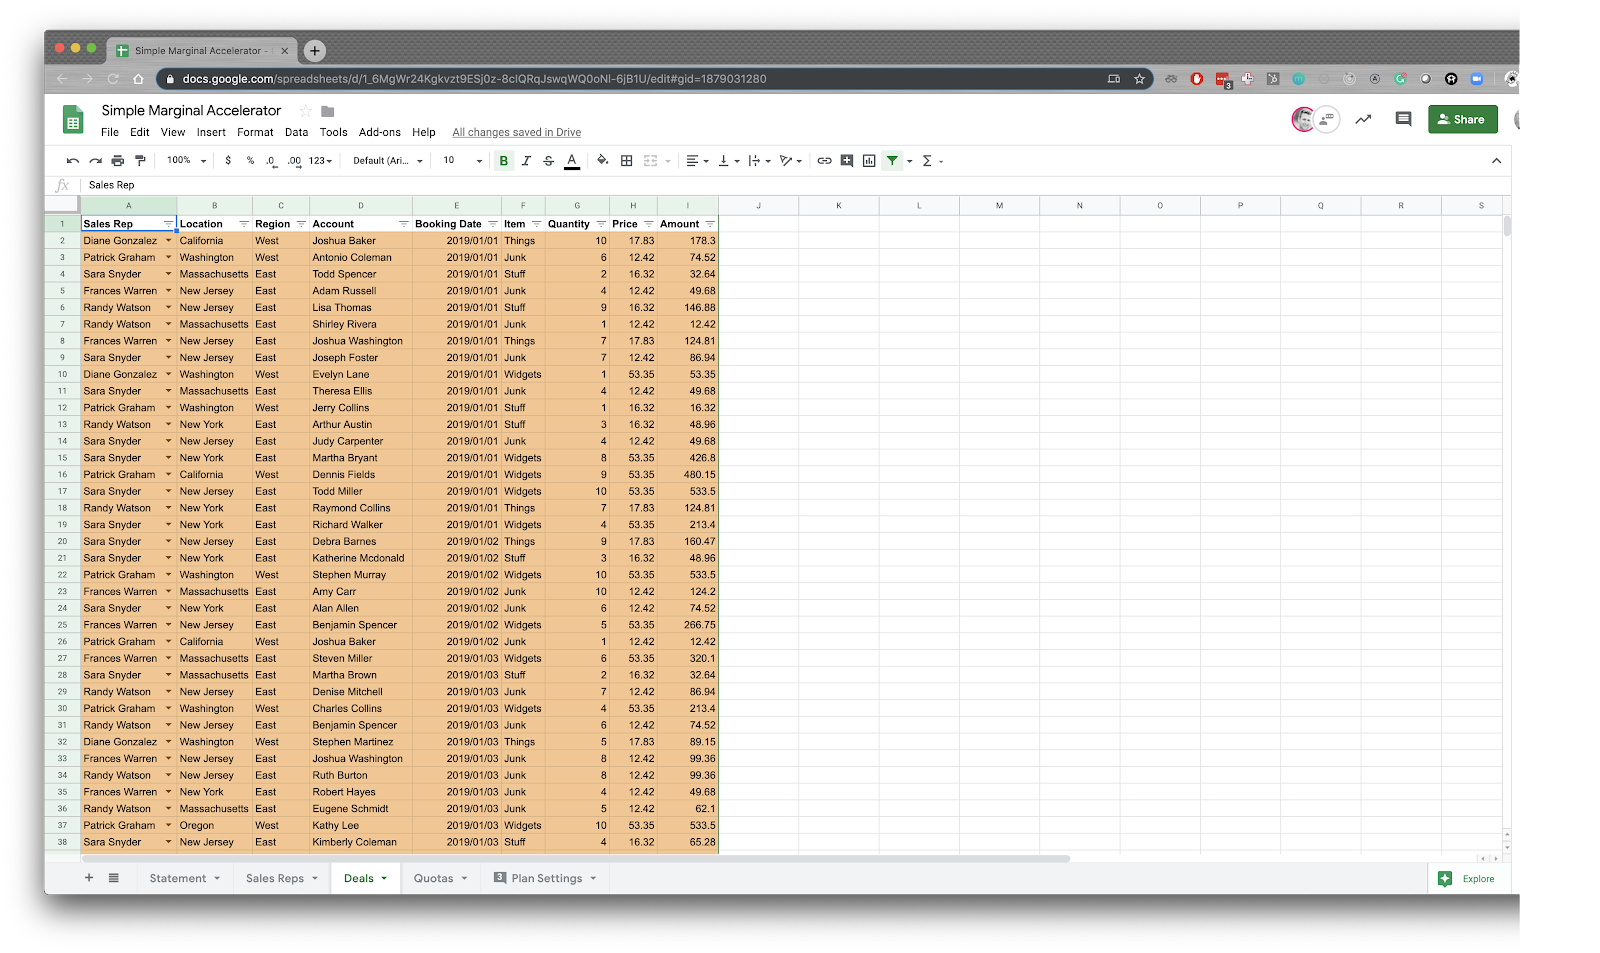
Deals
The main pieces of information we need on the deals are the name of the sales rep, the booking date, and the total amount. This is the key information that will be used to calculate not only the overall commission amount but the attainment and effective commission rate.
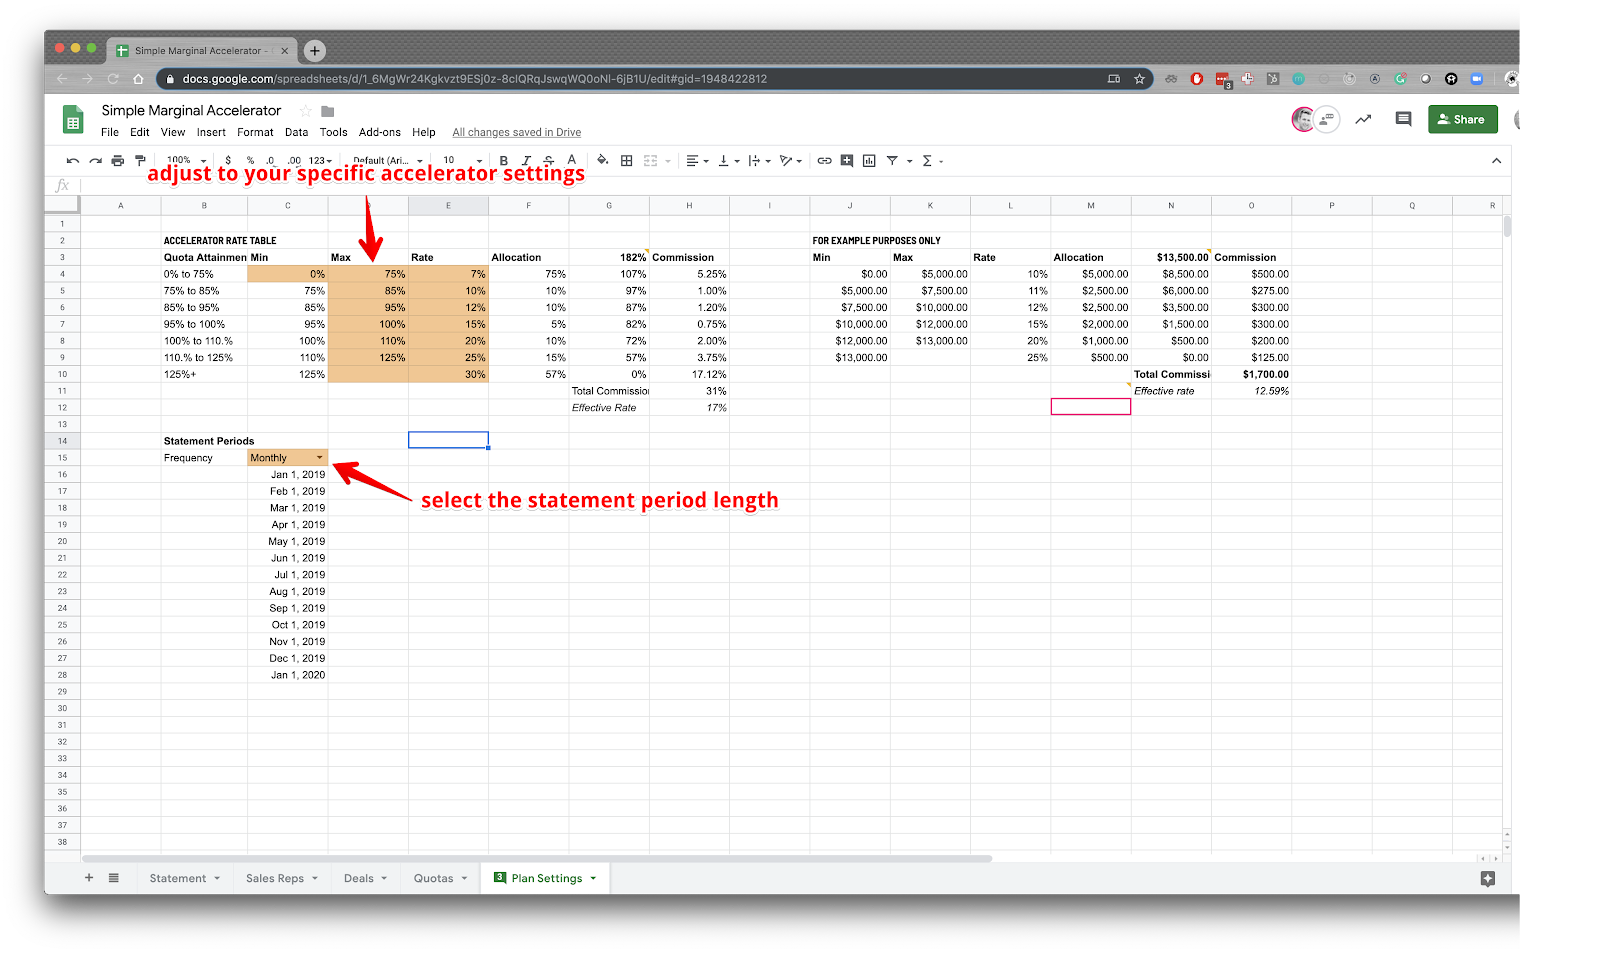
Plan Settings
There’s also a tab with a handful of settings that can be adjusted according to your particular specifications. Make sure you only adjust fields colored in yellow–the rest are calculated automatically.
Connecting it All Together
The sales reps are stored in what’s called a “Named Range”. I named it “salesReps”.
With this named, range, we can then reference it anywhere we want to reference a range of values–such as in data validation. On the “Statement” tab, for the “Sales Rep” dropdown, we add data validation to the cell and reference the “salesRep” named range.
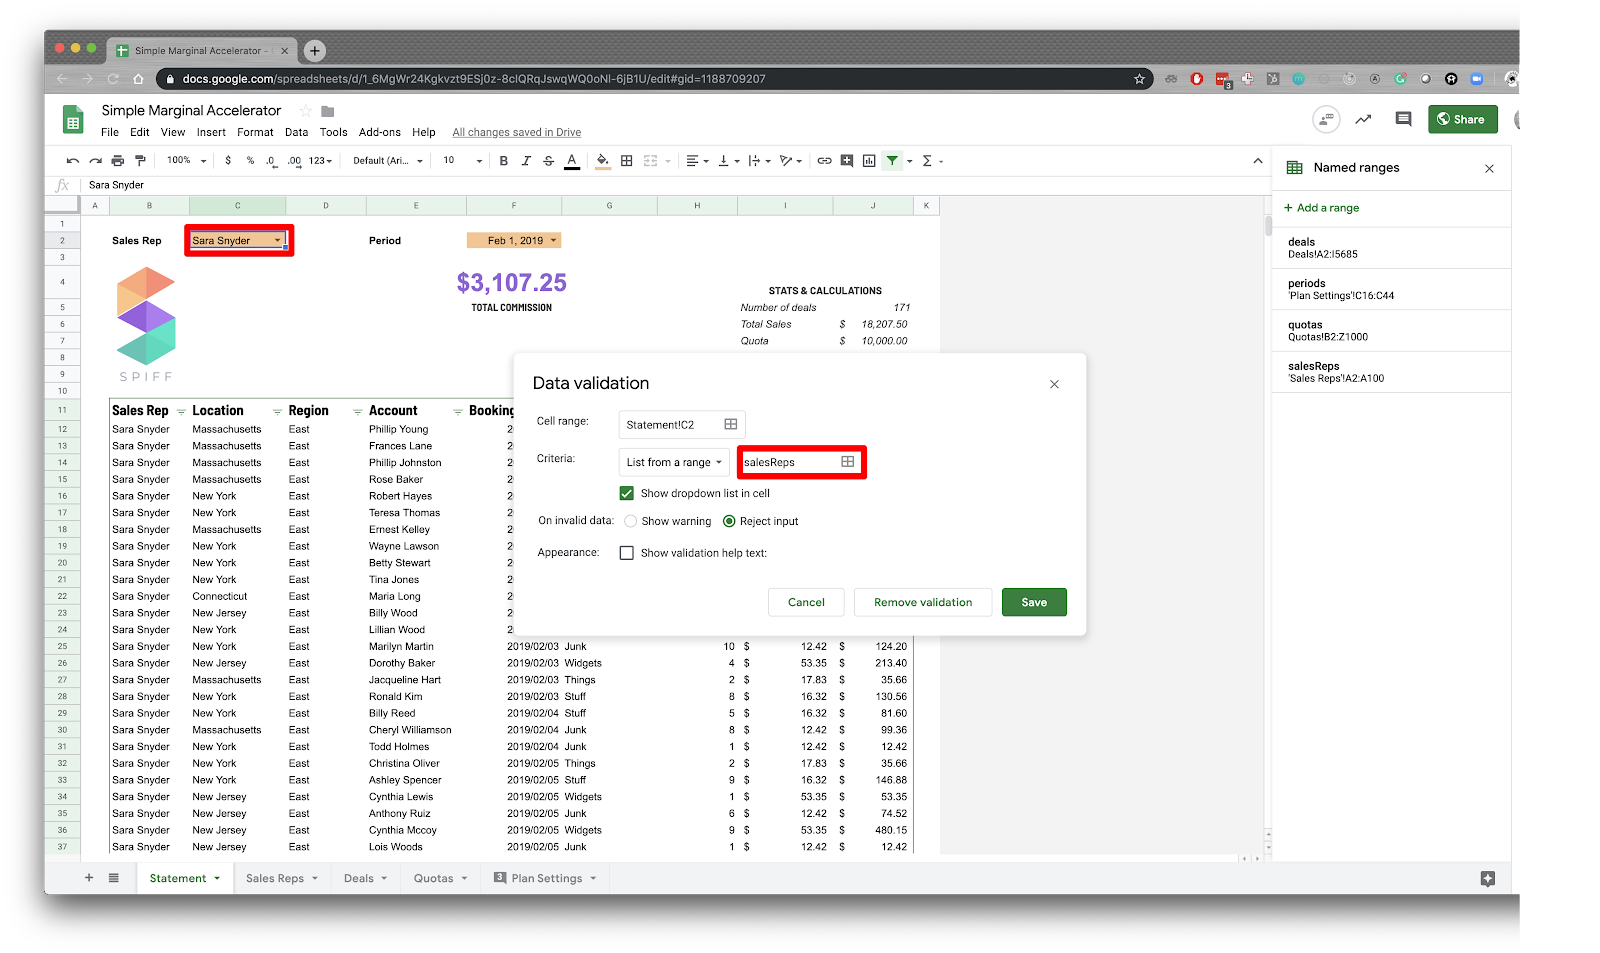
This allows us to create a dropdown list of the sales reps to ensure we can only select valid values. We did the same thing for the “Period” drop down list. Using these two, you can select which Rep you want to look at, as well as which period you want to generate the statement for. Selecting these two will set filters, and filter the list of “deals” data.
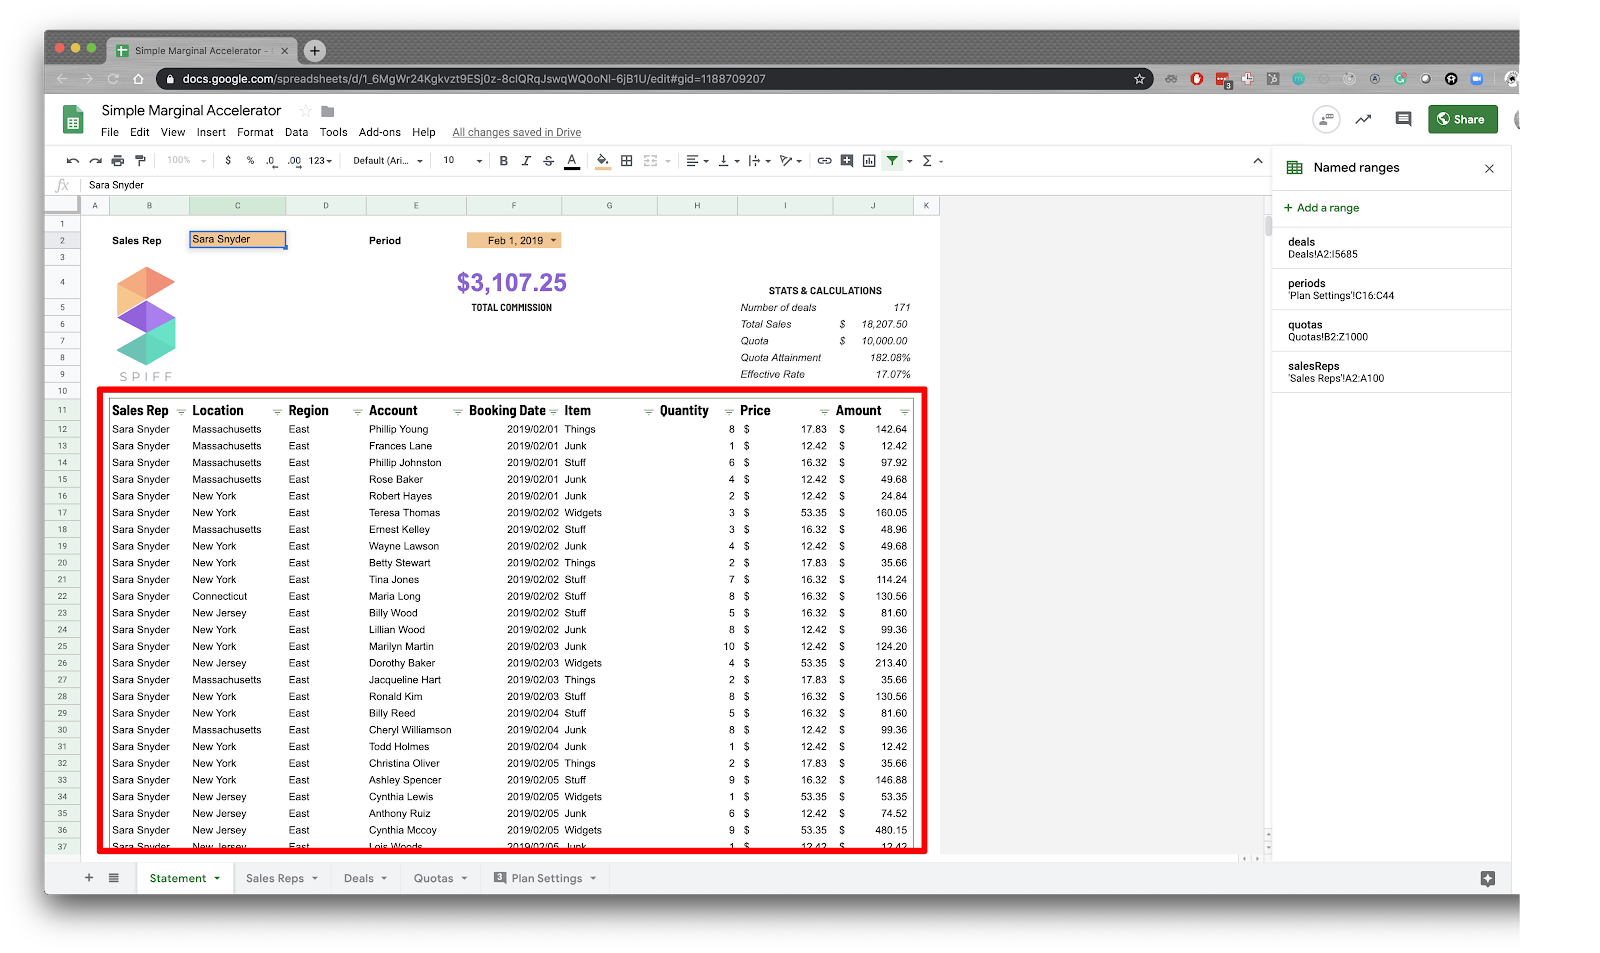
There are a couple things Google Sheets does far better than Excel. This next part is one of them, and it’s why I’m using Google Sheets instead of Excel. Plus, using Google Sheets I can easily share the end result with you 😀 Using a couple built-in functions, we can easily display a list of values in the table below the filters that actually meet the filter values.
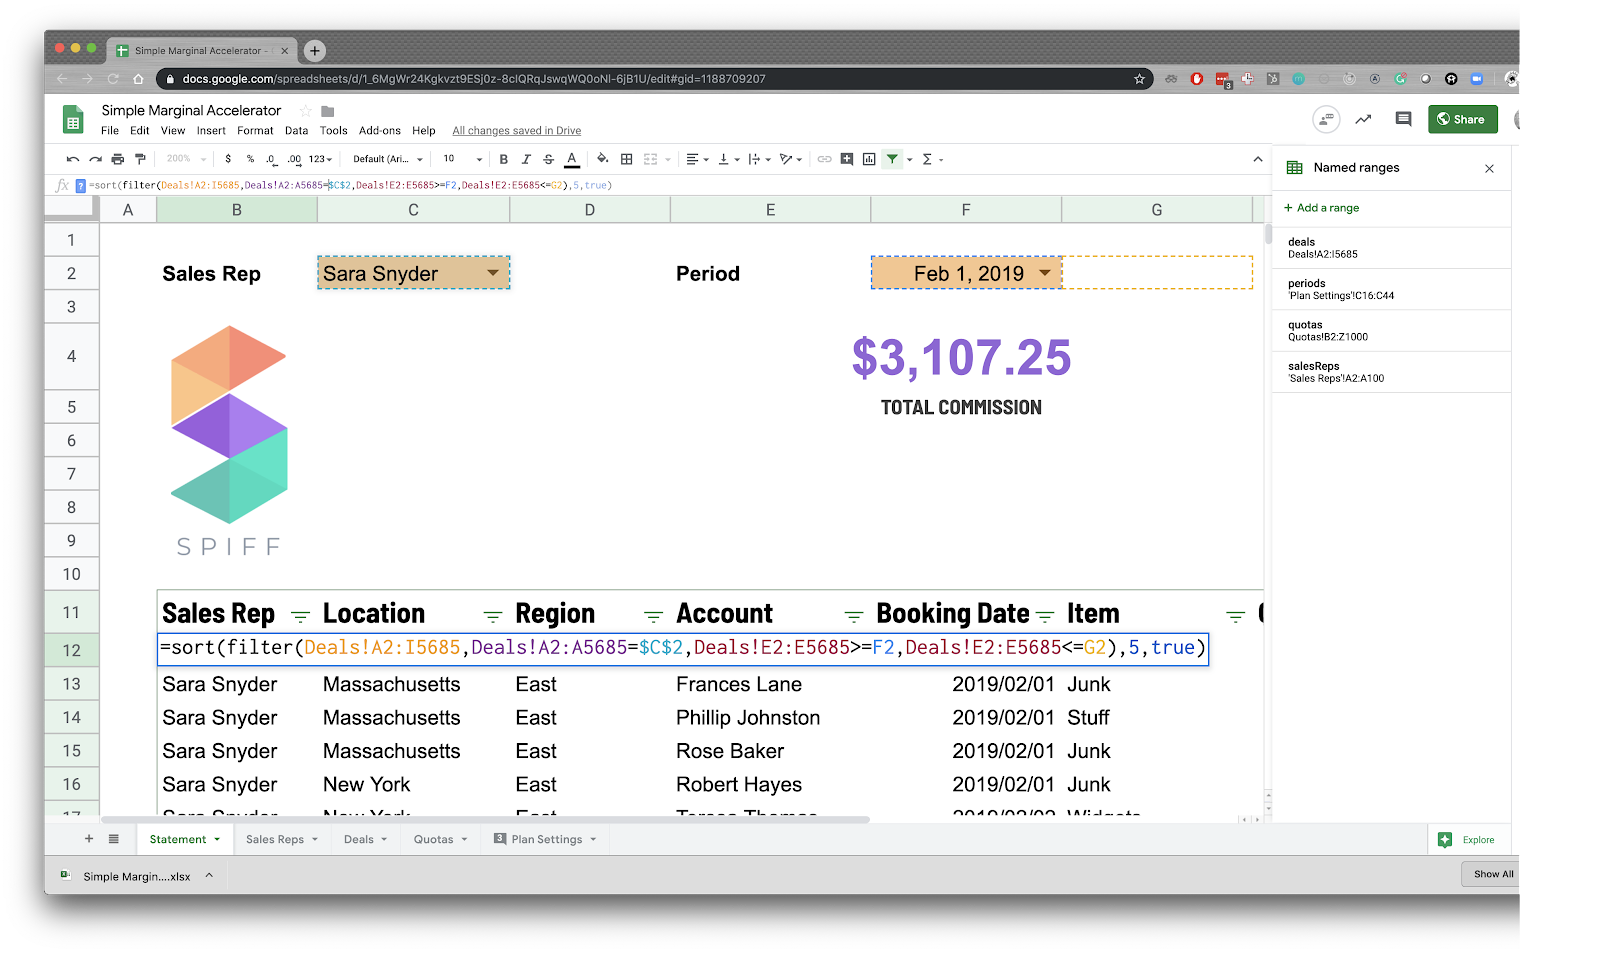
| =sort(filter(Deals!A2:I5685,Deals!A2:A5685=$C$2,Deals!E2:E5685>=F2,Deals!E2:E5685<=G2),5,true) |
Just like your middle school pre-algebra taught you with PEMDAS, we work from the inside out in these functions. The innermost function, filter, is taking the list of Deals (Deals!A2:I5685), and filtering them according to the period start and end date (cells F2 and G2 respectively). You can’t see anything in G2 because I colored the text white, but if you click on the cell, you’ll see it.
This returns an array of values that meet the filter functions. The next function, sort, takes the results from the filter, and sorts them by column 5, which is the booking date. The result of this function is a sorted list of deals as you see it.
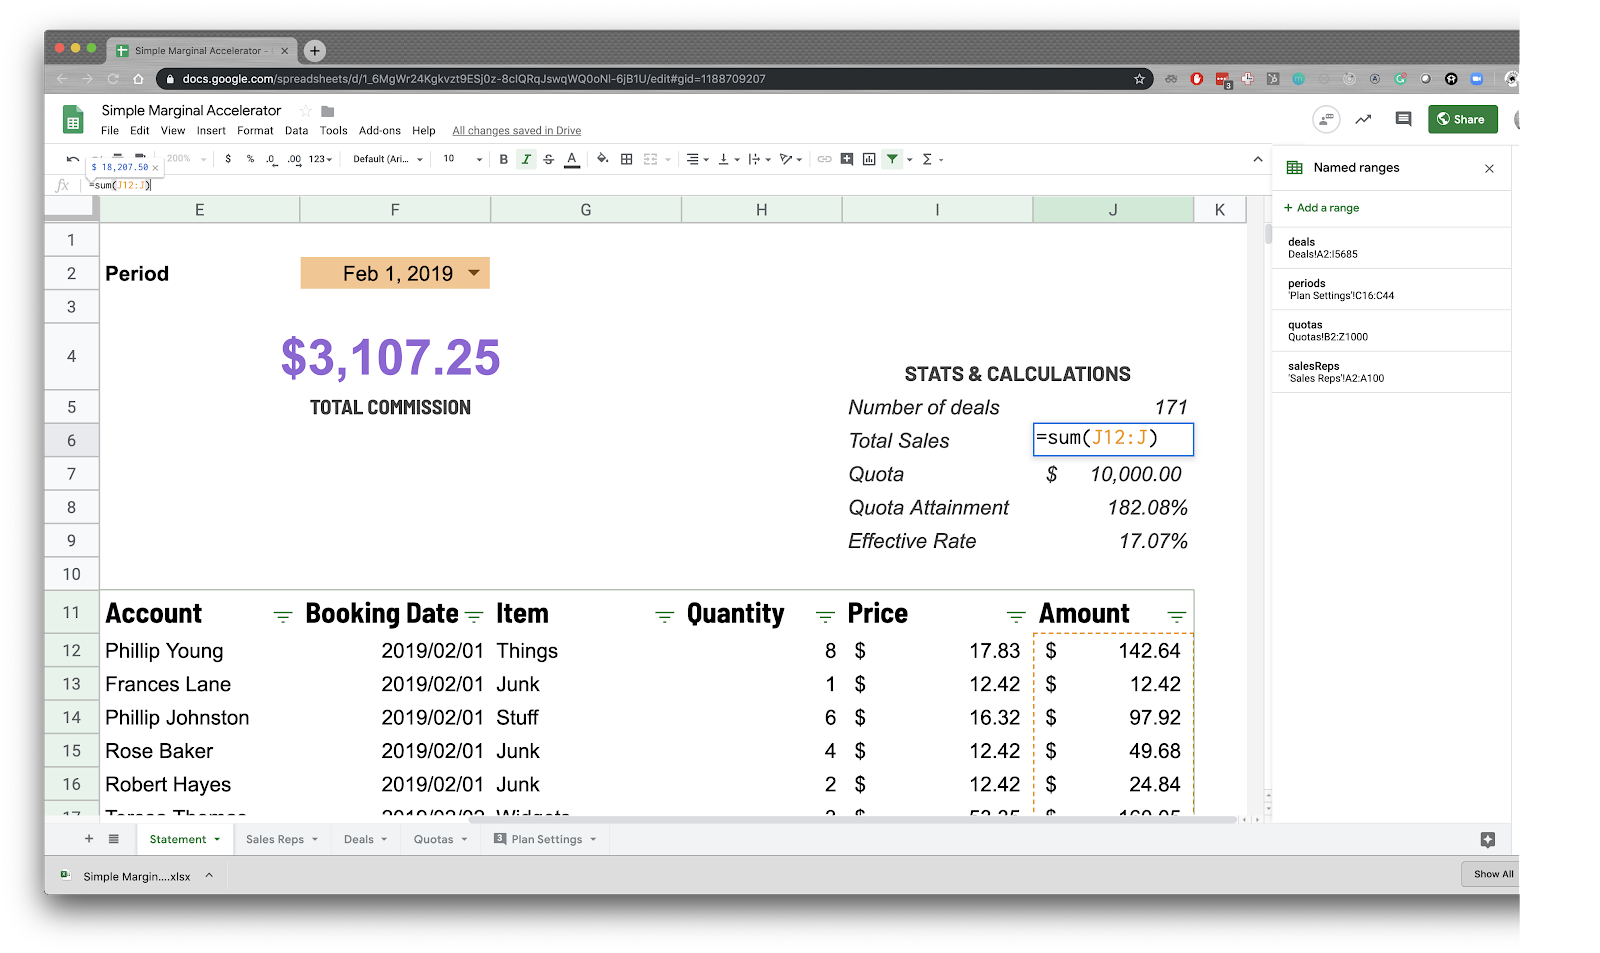
Next, we calculate the total sales by summing up the “Amount” columns. Notice on range we pass into the sum, the second value doesn’t have a row (it just says “J”). By not specifying a row, it goes all the way to the bottom of the spreadsheet without limits.
And look up the Quota value from the Quota tab. Index-match is one of the most powerful features in Excel. I’d recommend getting familiar with it, it’ll save your life in many ways, and perhaps I’ll write another article about that in the future, but for the sake of this article, all you need to know is this. First, you pass in a range of data (quotas) to index, and then you tell it which row and column to look at. The match function first looks to match the selected Sales Rep row, and the second match function looks to match period column.

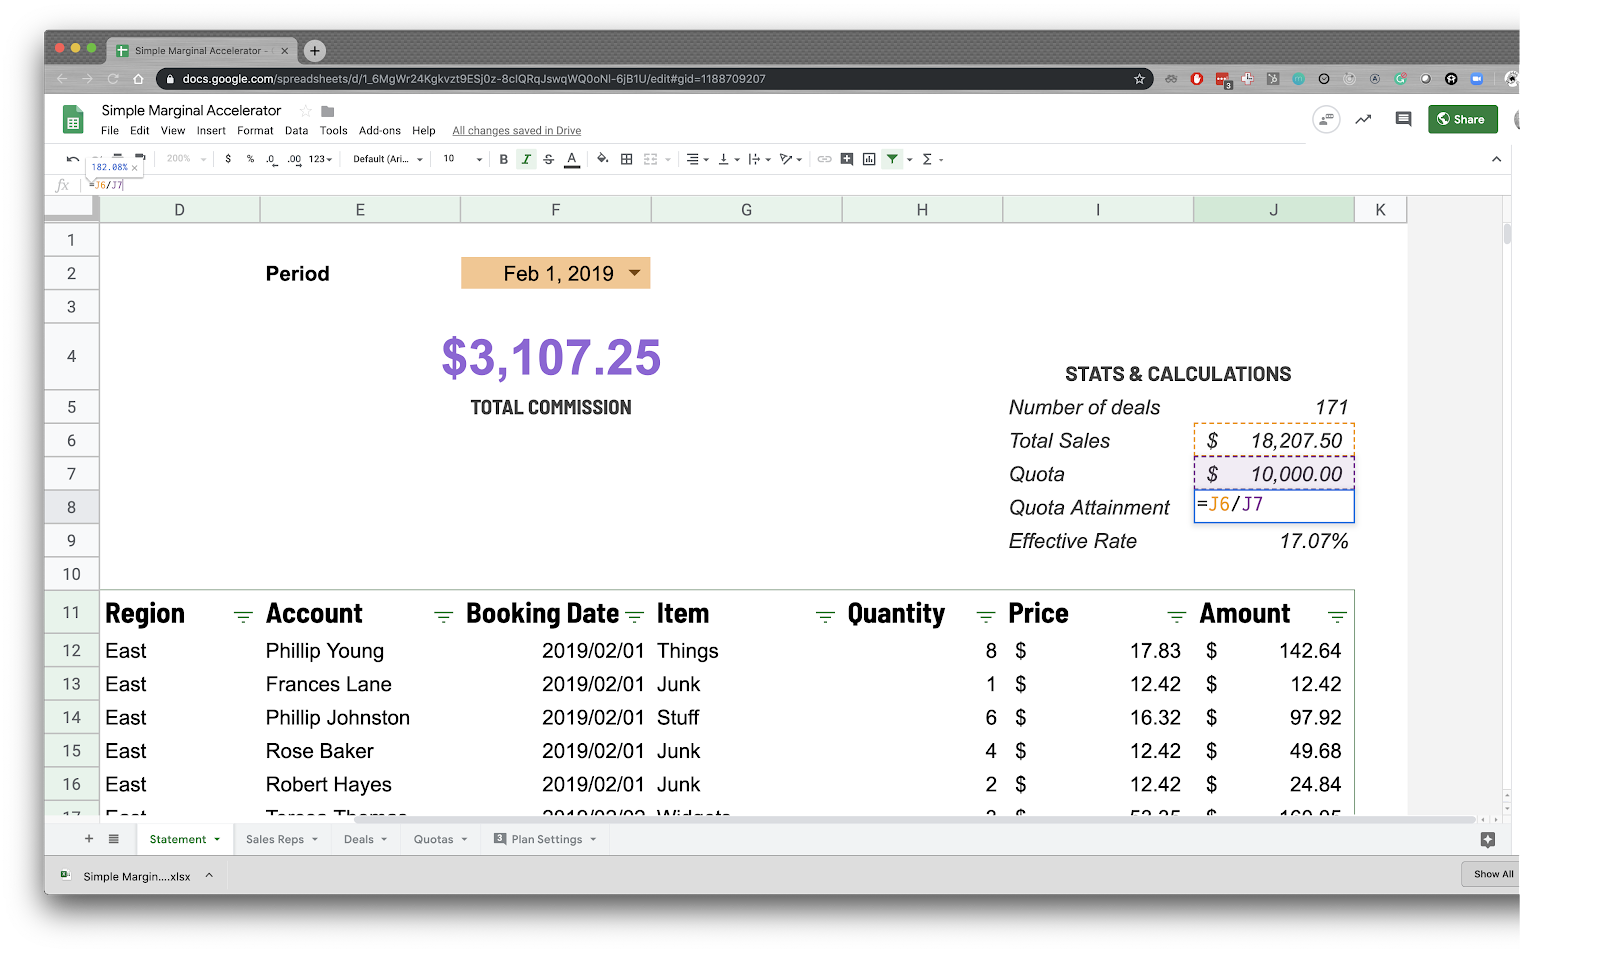
With the given quota and total sales values, we can calculate quota attainment (it comes out to be 182%).
Now we know the quota attainment, we can feed it into the accelerator table.
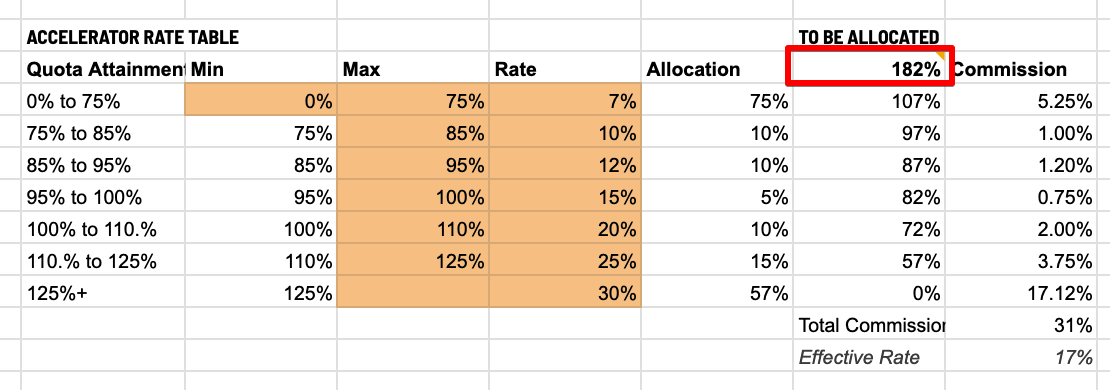
The orange fields are just hard-coded values, there are no calculations taking place. For the other columns, the calculations are as follows (modified to be more readable):
- Allocation: =if(Min>0,if(and(ToBeAllocated>(Max-Min),ToBeAllocated>0),Max-Min,ToBeAllocated),ToBeAllocated)
- Basically, we’re just checking if there’s anything left to be allocated.
- If there is, then we’re checking if there is more than fits into the Min-Max range.
- If there is more, then we take the Min-Max range, and if there isn’t, then we take whatever is left to be allocated
- ToBeAllocated: = Previous ToBeAllocated – Allocation
- Commission: =Rate*Allocation
Example Spreadsheet
Check out the actual file if you want specifics on the formula. After all is said and done, we get the effective commission rate of 17%.
Now that we know the effective commission rate, we can use this to calculate the overall commission by multiplying [ Total Sales ] * [ Effective Commission Rate ], and we get our total commission for this period.
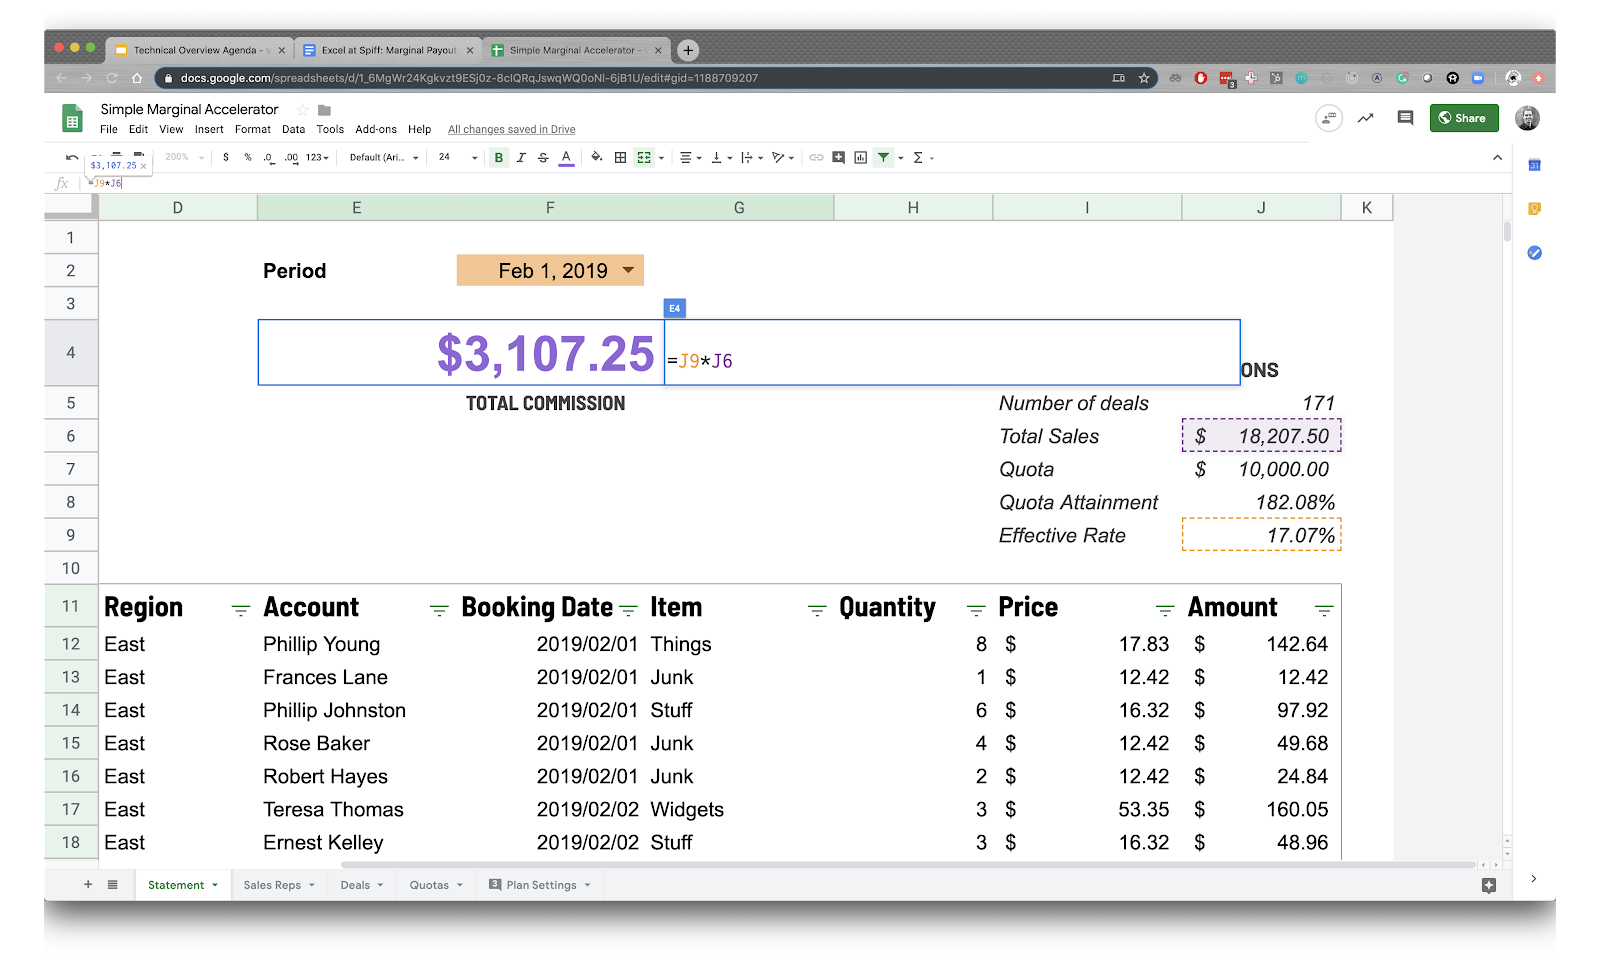
There you go! We’ve demonstrated how to dynamically handle a simple accelerator using marginal payout, with various quotas for different reps.
The Spiff Way
We hope this article is helpful for conducting your sales commission calculations in Excel. When you’re ready to get your life back, Spiff has you covered. For all of the steps we outlined above to get this working in Google Sheets, there are only a few steps required to actually make this happen in Spiff.
First, you create a simple accelerator table that is reminiscent of the one we built earlier for marginal payout using quota attainment.
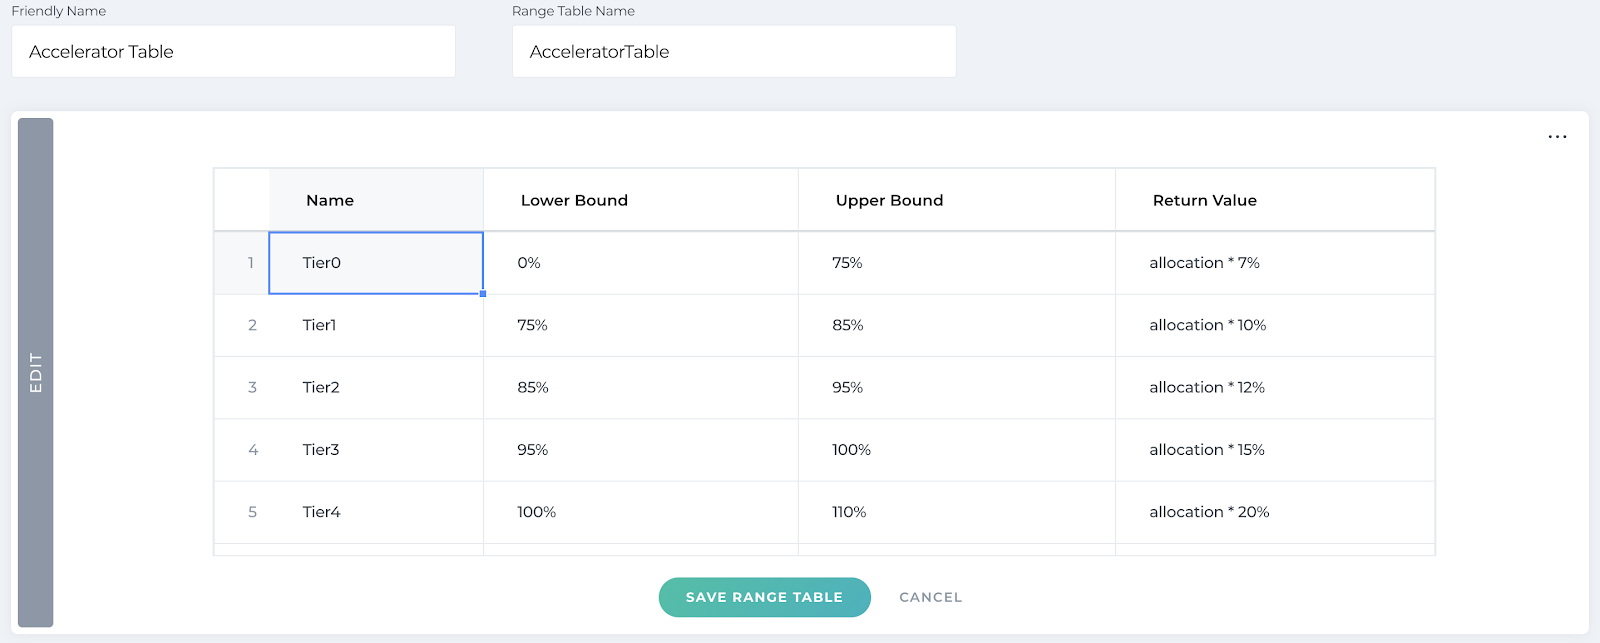
Then, you create a function that utilizes the simple “marginal_payout” function, passing in the Quota Attainment value and the table we used above. Similar to the example above, this will return the “Total Commission Rate” for the accelerator table, and then you want to divide it by quota attainment, which will give you the effective commission rate.

If you’re ready to get your Spiff on, contact us for a demo and see how we can give you your life back. Otherwise, stay tuned to keep Excelling at Spiff.


